« Can Western Global Elites Really Control their Endgame? | Home
Scenarios of degrowth: an introduction to causal loop models
By Karl North | October 6, 2025
Prosperity in the Western world (aka the American Way of Life) has been in decline for decades, and no government since Nixon has done anything significant about it. Nor could they, in the long run. As any oil geologist knows, it is all about the end of cheap energy. All policies attempted simply to kick the can down the road. Or to lay false blame.
A useful scenario of the mechanics of degrowth based on the end of cheap energy is the post from Tim Morgan, https://surplusenergyeconomics.wordpress.com/2020/11/23/185-the-objective-economy-part-two/. He shows how our consumption priorities shape a scenario of degrowth. A synopsis follows:
- Consumption has been “living on the life-support of financial manipulation”.
- As indebtedness reaches a saturation point, financial manipulation fails. Consumption declines.
- Degrowth in consumption starts with discretionary consumption.
- This depresses the whole sector of the economy that fuels discretionary consumption.
- The destruction of demand for debt follows the destruction of demand for discretionary consumption. Consumption declines further.
- All economic sectors dependent on consumption decline.
- This reduces income, lowering consumption further.
Causal loop models can help us visualize the dynamics of this degrowth process – how things change over time. Morgan’s scenario suggests a model structured as a positive feedback loop or two.
Causal loop models
Causal loop models are easy to read once the meaning of the symbols is explained. Briefly, the arrows tell the direction of causation between two variables. A positive sign means that the effected variable is changed in the same direction as the causal variable. A negative sign means that the effected variable is changed in the opposite direction from the causal variable. The label ‘R’ on a feedback loop means that change around the loop is reinforcing and causes exponential change over time. The universal name for this type is a positive feedback loop. The label ‘B’ on a loop would mean that the change around the loop balances or counteracts positive feedback. The universal name for this type is a negative feedback loop. I suggest reading the paper, Feedback Causality, which illustrates it in great detail with many examples.
A full model of any complex situation would include negative feedbacks that counteract exponential growth. In my partial model however, I think the following positive feedback loops are currently dominant in our society:
This model tells us how a change over time in the cost of energy affects our economy. Tracing change around the outer reinforcing/positive feedback loop: a rise in the cost of energy increases the cost of living and debt at all levels of society from consumer to federal toward a saturation point. This decreases the capacity of the financial elite to finance consumption, thus weakening the economy. As the economy contracts, income declines, raising the cost of living even more.
Tracing change around the inner positive feedback loop: a rising cost of energy raises the cost of living and cause consumers to forego discretionary consumption. This wipes out the discretionary part of the economy, thus reducing employment and raising the cost of living even more.
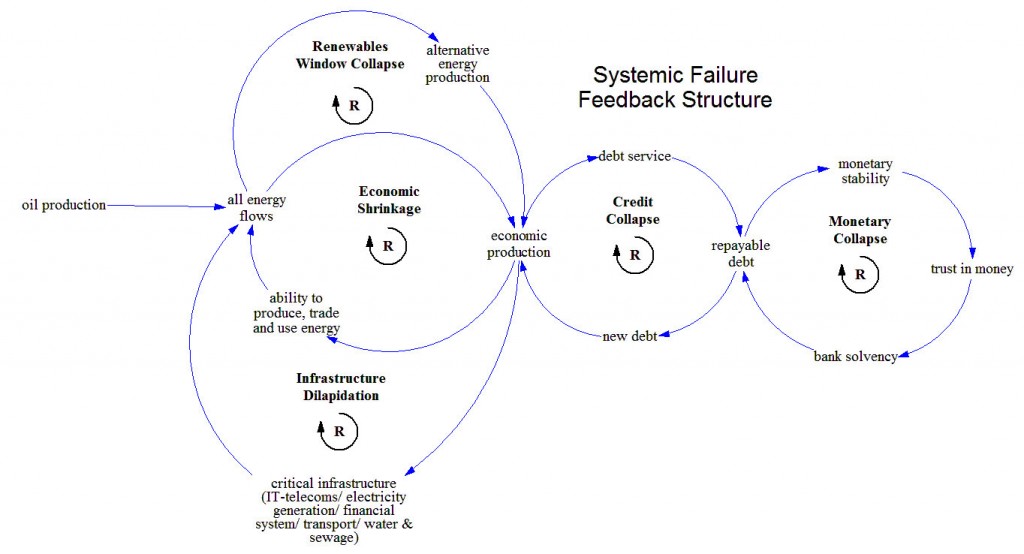
The above model elaborates part of a larger model shown below that summarizes how our society’s structural dynamics respond to the expected long-term rise in energy cost. You can test your model reading ability by adding signs to the causal arrows, then tracing change around the loops to understand how they work as reinforcing loops.
How useful are causal loop diagrams and the simulation models built on them? Over fifty years ago, scientists began applying the concept of feedback from engineering man-made systems to modeling the vastly more complex systems that we inhabit. With wider use, unfortunately many simulation modelers falsely assumed that the method could make accurate predictions, of which the method is not capable. Still, it allows us to study the complexity that arises from the interaction of many variables. It produces insights about the causes of the nonlinear behaviors this interaction generates, such as the rise and fall over time of the population of potato bugs in my potato patch, or even the rise and fall of a civilization.
Topics: Social Futures, Peak Oil, Relocalization, Uncategorized | No Comments »

