« Two Folktales for Comprehending Late Stage Capitalism and its Scientific Culture | Home | A sustainable agriculture research and education agenda to address a gathering crisis »
Introduction to Systems Thinking
By Karl North | January 21, 2010
A New Understanding of Root Cause—
Systems Thinking for Problem Solvers
By Karl North
“We’ll never be able to go back again to the way we used to think.” – anonymous holist
A Revolution in the Making
The insight that the world functions in complex, interdependent wholes drives a growing revolution in the way people are examining, understanding, and trying to manage our affairs in the world. We can find evidence far back in human history of attempts to comprehend how these wholes function.
Early glimmers of awareness of the ever-present feedback that ultimately drives what happens in the world come down to us from biblical maxims like “As ye sow, so shall ye reap”, and reveal themselves in common sayings like “What goes around, comes around,” “chickens coming home to roost,” and in the lessons of folktales. But as the scientific revolution gathered steam in the last two centuries, its goal of accurate prediction reduced its focus to pieces of wholes, and reduced its products to explanation of events and short-term causes.
Only lately have scientists, seeing the inadequacy of methods bounded by these disciplinary traditions, seriously sought more holistic ways of doing science. These efforts, described variously as ‘systems thinking’ or ‘complex systems science,’ are still small and have encountered plenty of resistance in the scientific community. In the words of one holistic scientist, “You can always tell the pioneers – they’re the ones with all the arrows sticking in their backs!” But they are creating powerful analytical tools that amount to a breakthrough in how science is done.
In the early seventies scientists used one of these tools, known as system dynamics (SD) to build a global model of what is causing the main threats to human civilization: unsustainable resource use, pollution, exponential population growth, and inequitable distribution of goods and services. Simulating various scenarios (superficial change, fundamental change, no change), they found none but the most difficult to carry out would prevent global overshoot of planetary carrying capacity, leading to at least some degree of collapse of present human populations and quality of life during the 21st century. Published under the title Limits to Growth, it became an international best seller and put the science of system dynamics modeling on the map. Quickly the model came under heavy fire from those in the scientific community who have a vested interest in older ways of doing science. Even louder criticism came from groups who have a financial interest in maintaining an economic system structured for endless growth. Nevertheless, republished several times with only minor revisions, the model has vindicated itself as the disturbing outcomes it pointed to over thirty years ago have so far come to pass. Today a consensus has emerged among top scientists of many nations that we need to take seriously the possibility of a global future that resembles one of the scenarios in Limits to Growth.
A New Tool
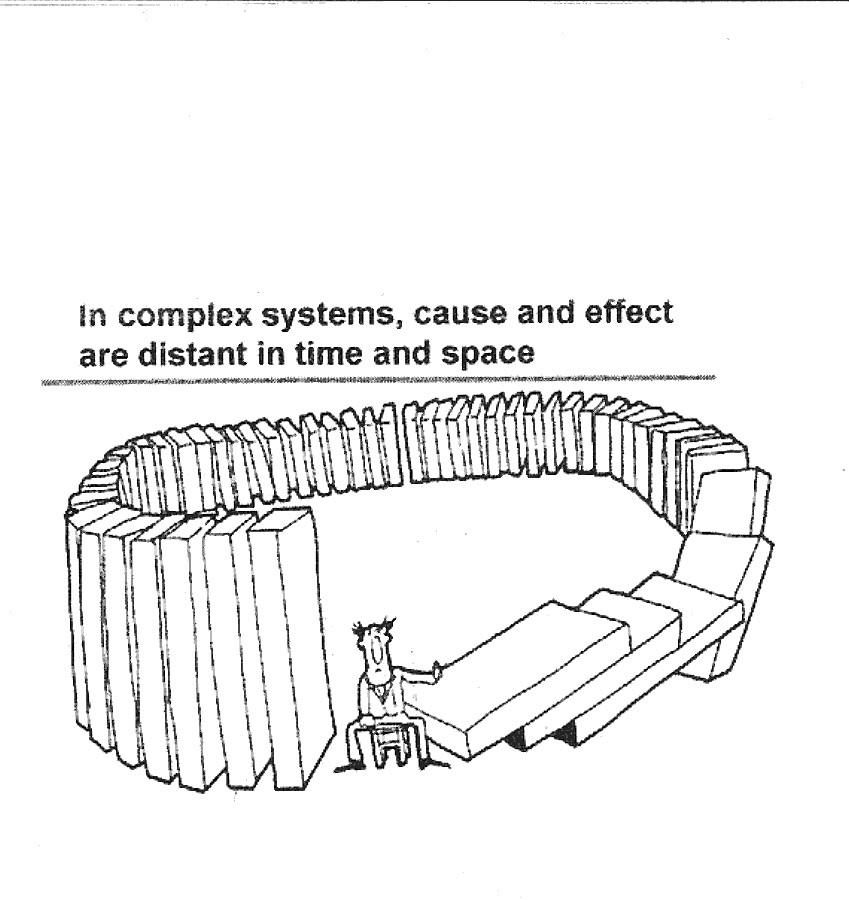
One of the most difficult skills in holistic decision-making is learning to visualize and plan for both short and long term consequences. We are foiled first by our seemingly built-in desire for immediate gratification, and second by the increasing difficulty of visualizing consequences that arrive later in time and more distant in space from our problem focus.
A second major obstacle in holistic decision-making derives from the limitations of looking for a root cause. Certainly it is good to search beyond proximate causes to find underlying ones. But burrowing beyond symptoms of problems, we often find not a root cause but a bewildering set of causes. Could the idea of one root cause be misleading us as to how wholes really work?
Systems science has created conceptual tools that can give us the understanding of causality that we need to get beyond ‘root cause’ and even come to grips with long-term effects.
Picturing Systems
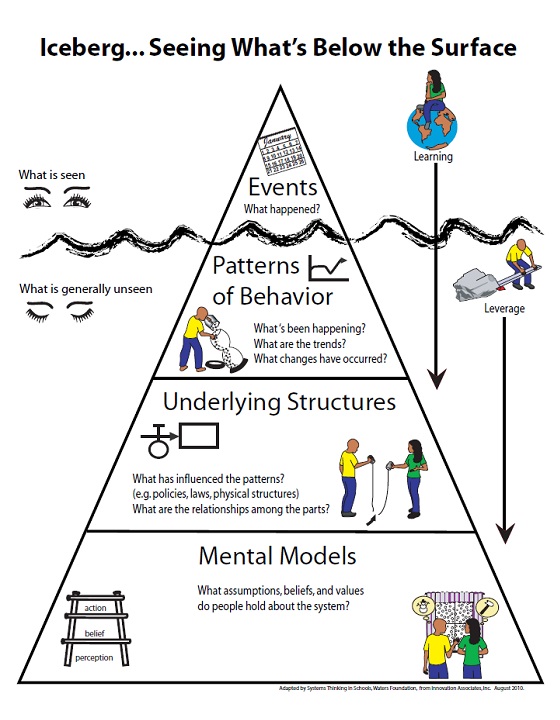
Wholes are like icebergs in that for many people the greater part of the system remains beyond their perception. Everyone can see events, although not always the most important ones. When the stream of events begins to reveal patterns of behavior, we need to pay attention, for these patterns are far more instructive than events. Most people can discern some patterns in space and time, but are not very good at it. The next deeper level, systemic structure, refers to the architecture of causal relationships that shape patterns of behavior.
Perception of system structure is a skill holists need to learn because causal arrangements usually generate the patterns of behavior that concern us in the wholes we manage. We operate from mental models of how the system works, but they are often faulty. This confusion is partly because our mental models are invisible, and partly because the linear, written language that has shaped much of our thinking distorts our mental models of how real systems work. In the real world, causality does not run in straight lines, as we shall see. Nor can we understand it piece-meal, as discrete sentences in our verbal language tempt us to do. We need a language appropriate to the task.
Developed in the US originally at Massachusetts Institute of Technology, the conceptual tools of SD include a very simple, but powerful diagrammatic language of systemic structure that:
- Improves our mental models of how the parts of a system interact through cause and effect to generate problem patterns over time, and
- Conveys our mental models easily to ourselves and to other stakeholders/decision makers, thus subjecting them to critical examination.
- Is precise, unlike verbal descriptions, which are subject to different interpretations.
Understanding Patterns
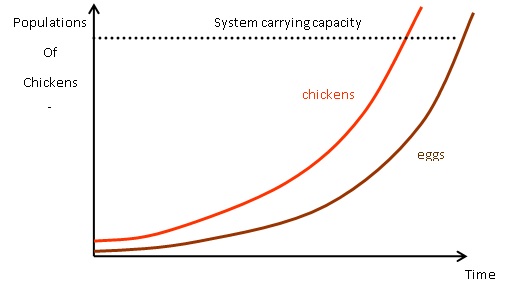
The first step is to define any problem dynamically by creating a picture of how a problem behavior arose over time. For example, if we are a chicken farmer and our populations of chickens and eggs are growing out of control, we could describe that problem dynamically this way:
The second step is a simple way of drawing pictures that show in a glance the structures in our wholes that we think explain such problem behaviors. Known as causal loop diagrams (CLDs) in systems science, this tool is one product of the systems thinking movement that most anyone can learn. Used regularly, it can broaden holistic perspective.
When seeking causes of problems we see in the world, why do we often find not a root cause but an interlocking range of causes? System science reveals that we are not in error. In complex wholes, cause does not come from one place; it comes from variables linked in circles. Because a change anywhere in the circle feeds back to impact the point of origin, these circles are called feedback loops.
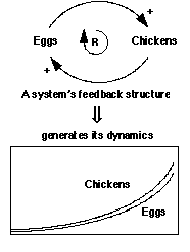
Thus, in a simple system consisting of chickens and fertile eggs, it is neither component, but rather the feedback loop, chickens-and-eggs, that is causing the system behavior—that stocks of both components grow exponentially over time. The one loop in our system example is called a reinforcing loop (R in the diagrams), because more chickens makes more eggs makes more chickens in escalating fashion. The feedback loops of the system (in this case only one) are its ‘structure’ and are what generates its ‘dynamics:’ what it does to the chicken and egg populations over time.
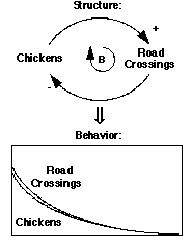
As any farmer knows, this simple system, structured as it is for exponential growth, would eventually overshoot the carrying capacity of its resource base and collapse. But systems science recognizes that there is typically another kind of feedback loop in most wholes, one that works to limit growth and stabilize the system. Chickens-and-roadcrossings is an example that might work in our simple demonstration system. The balancing loop (B in the diagrams) in this case is: more chickens tends to cause more road crossings, which in turn causes fewer chickens. By itself, this loop eventually leads to the end of the chicken population. But joined to the reinforcing loop, the system could generate the behavior the manager desires, depending on how the two loops are managed: which loop is allowed to become dominant.
Looking for Feedback
How do these revelations help us better understand the causes of problem behavior patterns we see in the wholes we must manage? From the SD perspective, the structure of all complex systems of every type and scale – the rumen food web of a cow, the soil ecosystem, the social network of a community or an enterprise, a local economy or a system of international relations, consist of sets of just these two types of feedback loops fitted together in many combinations.
Furthermore, it is this feedback structure that generates the long-term behavior trends in our wholes that we need to understand, and that humans have the most trouble grasping. So if we can begin to recognize and identify these two types of feedback in our wholes under management, some pulling, some pushing, we can do a better job of deciding where and when in this structure to apply leverage that will move the system in the direction we desire.
Understanding Cause & Effect
CLDs are ways to visualize linkages between important variables in your system where a change in one variable causes either a decrease or increase in another. The arrows show the direction of causality. So a change in the chicken population causes a change in the egg population. The signs (+, -) on the arrows have a special meaning, different from the usual one.
A plus (+) means that a change in one variable has an effect in the same direction on the other. Thus it means that an increase in the chicken population causes an increase in the egg population. And it also means that a decrease in the chicken population causes a decrease in the egg population. A minus (-) means that a change in one causes a change in the opposite direction in the other. So in this case it means that more road crossings tends to reduce the chicken population. And it also means that fewer road crossings implies a higher chicken population than there would have been had the number of road crossings stayed the same. All causal links effect change in either the same or opposite direction from the causal action.
As with causal links, feedback loops also occur in only two types, as mentioned earlier. To identify the kind of loop we must trace its causality around the entire circle. Starting with any variable, imagine either an increase or decrease, and trace the effect through all the elements of the loop. If a change in the original variable in the end causes an additional change of that same variable in the same direction, we call it a reinforcing loop (R) because it reinforces the original dynamic. More chickens means more eggs, which increases the chicken population even more.
If there are no balancing loops, a reinforcing loop will cause exponential growth (or decline) in all variables in the loop. If a change in the variable we start with leads to a change in the opposite direction, we call it a balancing loop (B) because it tends to counteract the original change. More chickens means more road crossings, which tends to reduce the chicken population (as chickens get hit by cars!).
Learning to see feedback structure and its consequences is not as complicated as it sounds. Like learning a musical instrument, it gets better with practice. An expanding branch of the SD network has taught elementary school children to diagram the feedback they experience in the wholes in their lives, and even to create simulation models on the computer where they can model the feedback structures in their lives and learn what consequences changes would have in the long term.
Once we see that cause and effect runs in circles, we can appreciate what a hash verbal communication makes of our understanding of system behavior, because it runs in straight lines (subject-verb-predicate), and rather too short ones at that. Then we can grasp the advantages of a diagrammatic language of circles and arrows that can communicate the dynamic, causal interconnections of all system components at a glance. This language is information dense, packing pages of prose into a single picture, and unlike prose, the language is unambiguous.
Anticipating System Surprises
Folktales like The Tortoise and the Hare reveal insights about the holistic way the world works. This folktale demonstrates the counterintuitive behavior that systems dynamicists say is an abiding characteristic of complex systems. We expect the hare to win the race, but it is the tortoise that wins. Many of our management and design failures happen because we fail to recognize system feedback structures that generate these surprising, unexpected results. Common examples of “fixes that fail” from unperceived feedback are:
- Information technology has not enabled the “paperless office” – paper consumption per capita is up
- Road building programs designed to reduce congestion have increased traffic, delays, and pollution
- Despite widespread use of laborsaving appliances, Americans have less leisure today than 50 years ago.
- Antibiotics have stimulated the evolution of drug-resistant pathogens, including virulent strains of TB, strep, staph and sexually transmitted diseases
- Pesticides and herbicides have stimulated the evolution of resistant pests and weeds, killed off natural predators, and accumulated up the food chain to poison fish, birds, and possibly humans.
- A system of unrestrained free trade generates monopolies that control trade.
In each of these cases, failure stemmed from an inability to identify feedback structures and anticipate how they would play out. And in every case, because of delays characteristic of feedback in complex systems, short-term success preceded long-term failure. This contrast between short- and long-term consequences of decisions has been one of the hardest things to learn about managing wholes. It needs more attention.
Parasite Problems
I said before that looking for the root cause gets us only part way to an understanding of the downstream consequences of decisions because we have been taught to perceive change in the world as unidirectional, where problems lead to actions that lead to permanent solutions. Building visual models that show all the important causal relationships that contribute to a problem behavior can get us much further. Let’s take the example of what decision would best control parasites in sheep.
Although we may have heard of disadvantages of medication, we are probably already doing it, so we use the “Five Whys” and decide that the root cause is that we are failing to medicate routinely. So we apply routine parasiticide treatments to the sheep and sure enough, it works. We can model the causal relationship this way:
The arrow shows the direction of cause and effect, and the sign (-) tells us that a change in the first variable causes a change in the opposite direction in the second variable. So if we decrease routine parasite medication of the flock, the parasite population in the flock will increase, all other conditions remaining unchanged. It also means that if we increase routine parasite use, the flock parasite population will decrease.
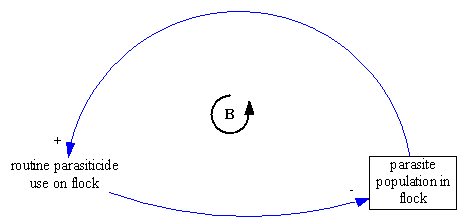
Since stepping up routine medication is expensive in materials and labor, the favorable effect of a decrease in the parasite population may lead some shepherds to eventually cut back again on the number of medications. We can model this response this way:
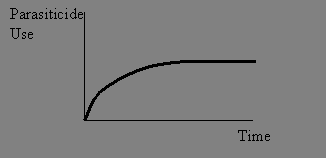
This shows that the original ramp up of treatment led to a response (reduced parasite population) that in turn prompted another response (reduced medication) in the same direction, thus reducing parasiticide use. This is the meaning of the plus sign (+). The final effect was to feed back and counteract the original action. For clarity we identify this feedback as a balancing loop (B), because it tends to set limits on any tendency to continually increase (or decrease) the level of treatment, as shown in the time graph.
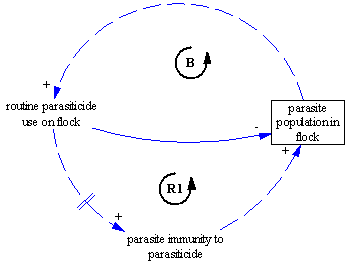
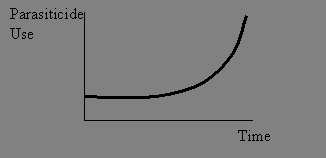
Regardless of whether the balancing feedback behavior occurs, in every case other things are happening over time, which are important to understand. Increases in routine medication cause the parasite population to adapt with improved genetic immunity to the medication, leading to mounting flock parasite populations, and further increases in medication, creating a reinforcing feedback loop R1 (dotted lines) with its typical accelerating behavior over time in all variables:
We show that the genetic immunity occurs slowly by drawing a delay marker on the arrow (//). One might conclude that this is easy to understand without building a model, but the fact that shepherds, veterinary specialists, and the scientists who created the medication have managed to gradually destroy the efficacy of most sheep parasiticides by advocating or practicing routine use suggests otherwise.
Ramping up routine parasiticide use on the flock has another downstream effect. Because the flock is constantly medicated, the shepherd cannot tell which sheep are genetically most vulnerable to parasite infestation. Opportunities to select for genetic resistance decrease. So the flock becomes increasingly genetically addicted to the medication. Dependency causes higher parasite populations than would be the case without the addiction, all other things being equal. The end result is endless increases of medication levels, modeled in reinforcing loop R2 (dotted lines), also a loop with delays.
Furthermore, the model makes clear that feedback loops R1 and R2 have a 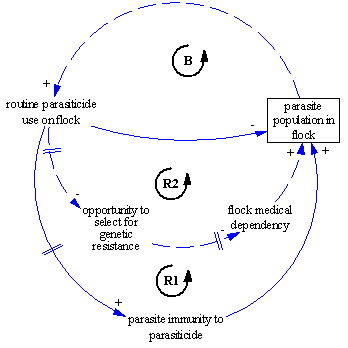 multiplier effect on each other as they relate to management of the problem. All these effects are counterintuitive responses to the more routine use of the medication, responses that are not even mentioned in textbooks that teach livestock parasitism in graduate courses in major agricultural schools! The tragic end results for the sheep industry are gradually diminished genetic parasite resistance in most common commercial sheep breeds, compounded by an increasingly useless set of common parasite medications.
Seeing The Whole
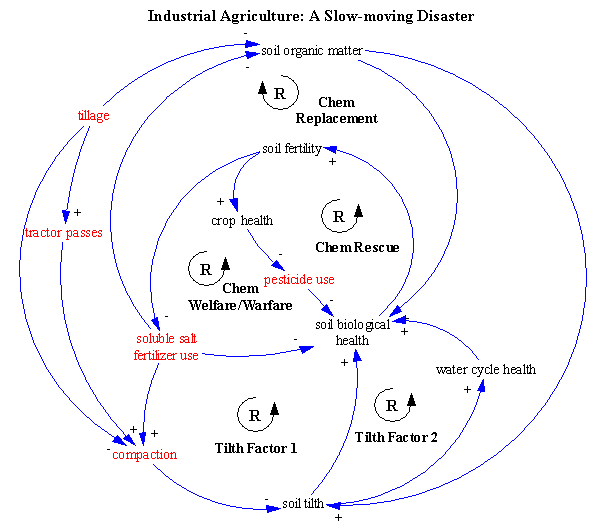
Learning to build the causal loop diagrams that SD scientists have created as 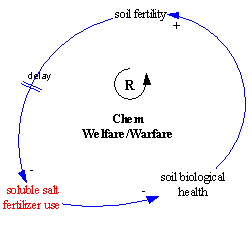 a learning laboratory can help us identify and understand the interdependencies in the wholes we manage. Sometimes they reveal things we want to avoid. Let’s build a diagram of problems visible in industrial agriculture to show how this works.
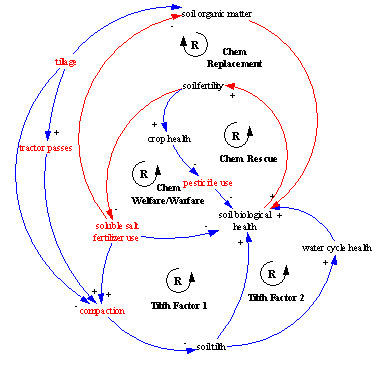
Suppose our problem focus is soil biological health, which we see deteriorating over time. This diminishes soil fertility, which 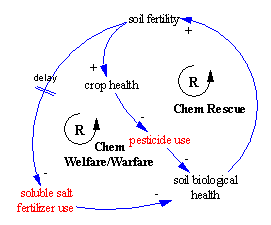 induces increasing soluble salt fertilizer use, causing soil biological health to deteriorate even more. Here we have a classic reinforcing loop.
It facilitates good communication to give feedback loops labels that evoke the behavior they generate. I call this one Chemical Welfare/Warfare because these fertilizers have both an initial positive effect and a long-run negative one. I show one of the delays that generate this classic long-term/short-term effect. Can you add others?
To compensate for the declining crop health that accompanies salt fertilizer use, farmers increase pesticide use, with negative toxic effects on soil biological health. We depict this by adding another reinforcing loop I’ve called Chemical Rescue. Compaction and the practices that produce it bring two tilth loops into the picture. Finally, increasing dependence on chemical fertilizer leads farmers to neglect soil organic matter, so we add the Chem Replacement loop.
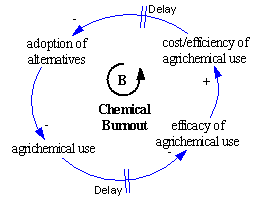
Eventually, diminishing returns and other accumulating problems, whose interactions are visible in the diagram, could strengthen a counteracting feedback loop of the type we saw earlier in chickens-and-road crossings. As it is a balancing loop, more agrichemical use leads after delays to less agrichemical use. It appears here alone only for clarity purposes. Can you integrate it with the full diagram?
The complete CLD shows how all the reinforcing loops containing the red variables have a negative impact on soil biological health, possibly with a multiplier effect, which is now more easily recognizable in the diagram than in a prosaic description. But it also shows how, by adding soil organic matter, these vicious circles can be reversed to become virtuous circles. Can you trace the causality to see how this works?
Feedback Structure Generates Behavior – Pogo’s Law
Characteristic of systems thinking is its focus on the patterned system behavior that generally arises out of the feedback loop structure of the system itself. Interactions among feedback loops, rather than specific variables, cause dynamic behavior (behavior through time). SD modeler Paul Newton calls this “feedback causality.”. External inputs or shocks simply act to trigger dynamic behavior latent in the feedback loop structure.
But our world consists of nested wholes, so where do we set the boundaries? A basic tenet of SD science is that the dimensions of the problem that interests us must guide our selection of the boundaries. This tenet directly contradicts the conventional wisdom of reductionist science: that the boundaries implicit in expert knowledge and its closely guarded turfs are useful in understanding how wholes function. If we want to know why big agriculture consumes family farms, it helps little to focus on farm or even watershed ecosystems and their processes. The system feedback structure that is generating the problem behavior—a shrinking farm population—lies beyond even the agricultural economy.
The historical pattern of big fish swallowing little fish occurs in every sector of our economy. So the boundaries of the system we need to look at to understand what causes this pattern encompass the whole economy, the political rules that govern it, and the knowledge and information institutions that shape people’s behavior in the whole society.
Boundary flexibility is a principle of systems thinking that is especially important in our society where compartmentalized scientific knowledge has created strong habits of boundary rigidity, with its resultant pattern of solutions that fail. Moreover, boundary rigidity often produces bounded rationality, where solutions that will fail actually are logical within the limited perspective of the problem solver. If I am sick and I believe that people in my village possess evil powers to cause sickness, then obviously I need to go witch hunting. If plants need nitrogen to create protein and nitrate fertilizer provides it and improves plant growth, why look at the problem further?
In stark contrast, the motto of the SD community: “Always challenge the boundaries!” is a directive to look critically at specialist knowledge flawed by research boundaries set by ideology, disciplinary convenience, or conventions of academic training. Thus systems thinking teaches an endogenous focus: to either look within the whole for the relevant causal structures or expand the boundary of our inquiry to encompass them. Whence the ring of the holist in Pogo’s famous challenge, “We have met the enemy and he is us!”
Causal Loop Diagrams can be a useful lens to help us view our wholes in action, and thus develop a whole new perspective on the world. I hope you will try drawing feedback structures to gain understanding of the problems in your lives. All it takes is pencil, paper and thinking cap. Learning to build visual models of the feedback structure that is generic to all social and biological systems can help decision makers:
- · Visualize the history, not just of a problem, but also of the causal relationships (the structure) of variables that might relate to the problem.
- · Put into pictures your mental model of these causal relationships, pictures that can reveal the multiple effects of management policies, effects that often return (feed back) to create resistance to effectiveness of those same policies, if the system structure is left unchanged.
- · Examine the possible future history of your decision and its multiple consequences, based on your picture of causal relationships.
This essay touches only the surface of the body of insights that the study of system dynamics can divulge, hopefully whetting your appetite for further exploration of the expanding science of the heretofore mysterious creatures that make up and structure our world, known in SD as complex, adaptive, self-organizing systems.
The systems thinking resources listed here include some that teach how to read and create causal feedback diagrams.
www.stewardshipmodeling.com The site of my mentor Paul Newton. He strongly believes in access to systems thinking at all educational levels.
http://www.globalcommunity.org/timeline/74/index.shtml#top A wonderfully non-technical essay, as much for the right brain as the left, by Donella Meadows, who was one of systems thinking’s shining lights.
http://www.clexchange.org/gettingstarted/msst.asp This is a good set of instructional materials.
http://www.clexchange.org/curriculum/roadmaps/ A more comprehensive curriculum.
http://www.exponentialimprovement.com/cms/uploads/ArchetypesGeneric02.pdf This paper is a good explanation of systems archetypes, which are very useful to learn to recognize because they explain problems that occur in a wide diversity of areas of life.
https://www.youtube.com/watch?v=izYx2Pi-t78 This video teaches you to use the free Vensim software to draw causal loop diagrams, as I used it in the paper.
Systems Thinking Basics, by Virginia Anderson and Lauren Johnson, 1997. Teaches the practical tools of systems thinking: behavior over time graphs and causal loops.
The Fifth Discipline Fieldbook, by Peter Senge et al, 1994. A manual of techniques, games, and stories to learn systems thinking (what Senge calls the ‘fifth discipline’).
The Fifth Discipline:The art and practice of the learning organization, by Peter Senge, 1994. An easy introduction to systems science and its application to the management of social organizations. Written for nonscientists.
Limits to Growth: The thirty year update, by Donella Meadows, Dennis Meadows, and Jorgen Randers, 2004.
References:
The chickens and eggs example herein, among others, originated in John Sterman’s book: Business Dynamics: Systems Thinking for a Complex World.
Topics: Core Ideas, Recent Additions, Systems Thinking Tools | 2 Comments »

June 4th, 2016 at 5:02 pm
Thinking of all concepts in the real system as continuous quantities interconnected in loops of information feedback and circular causality.
March 9th, 2020 at 6:42 pm
[...] and time delays, the total number of chickens could take different sizes over time. Check out this post by Karl North, a perfect introduction into systems thinking!!!So clearly, already the chicken and egg problem is [...]